# March 25, 2025

This release introduces new capabilities and usability improvements, including:\
**🎯 Traffic Top Presets for faster investigations**\
\&#xNAN;**⏱️ User Inactivity Timeout configuration**\
**🔎 Prominent Table Filter Indicators for visibility and ease of use**\
**📐 New threshold functions (averagein(), countin()) for high-latency ingestion detection**\
**👥 Roles Page now displays inline permission summaries and supports column filtering**\
**📝 Event Details Page refinements for layout and interaction improvements**

### 🎯 Traffic Top Enhancements

**Traffic Top** has been improved to make it easier to use and more valuable for investigation.

* **bits** is now an available column
* Traffic is now sorted by Count (descending) by default
* **Aggregate by** now has a search bar at the top

#### Traffic Top Presets

There are a new set of buttons at the top of the Traffic Top page that provide preset configurations for common ways you can leverage Traffic Top for investigations.

<figure><img src="https://files.readme.io/143bef5a55c17d3a8b163588644595116cfc32a4abd87677e7c3f9e51782c2a7-Fusion-TrafficTop-Preset.png" alt="Traffic Top Preset Buttons"><figcaption><p>Traffic Top Preset Buttons</p></figcaption></figure>

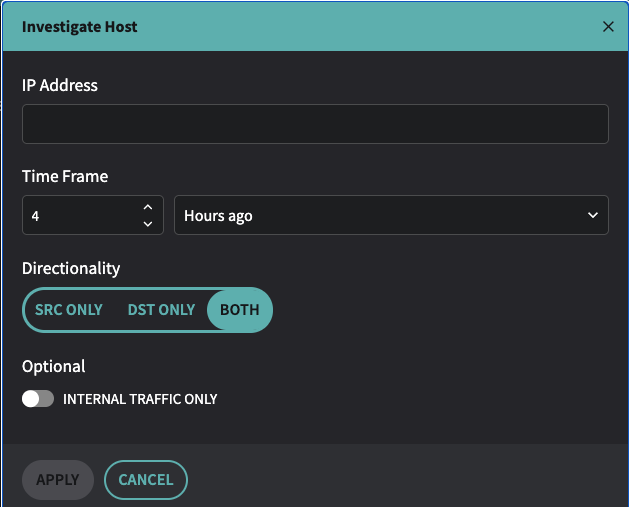
<figure><img src="https://files.readme.io/750bfcb23568a6bdc2c0cbcd26d90cfa4660e0b14986ecb0f696359d61b4c620-Fusion-TrafficTop-Investigate.png" alt="Traffic Top > Investigate Hosts Configuration" width="400"><figcaption><p>Traffic Top > Investigate Hosts Configuration</p></figcaption></figure>

### ⏱️ User Inactivity Timeout

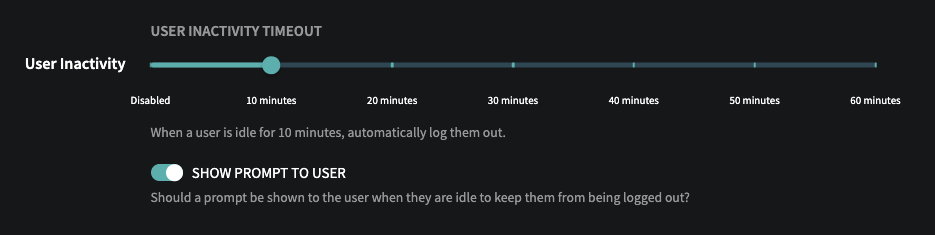
There is a new configuration option for setting a **User Inactivity Timeout** on the **Settings > User Management > Global Security/SSO** page. This allows administrators to define how long a logged-in user can be idle before they are automatically logged out of the Fusion Portal. This is *Disabled* by default, to avoid changing the behavior for existing users.

<figure><img src="https://files.readme.io/5f728f5bf1b9b0d819563b8bc19d366b628a6ad1750212a2b048bcac5cecf842-Fusion-UserInactivity.png" alt="User Inactivity Timeout Configuration in Settings > User Management > Global Security/SSO"><figcaption><p>User Inactivity Timeout Configuration in Settings > User Management > Global Security/SSO</p></figcaption></figure>

### 🔎 Table filters are now prominently displayed

*If you have ever added a filter to a column in Fusion, and then later gone back to that table and wondered why isn't all the data showing up only to realize it was because you had applied a filter, this feature is for you.*

Filters applied to a table (by hovering over a column name and then selecting the filter icon that appears), are now displayed directly above the table, where they can be viewed and removed.

<figure><img src="https://files.readme.io/988e29a7b2781850d51c8a68c72983475d0a93c7ead0259c57f963dda3d55dbe-Fusion-TableFilter.png" alt="Example of multiple filters applied to a table"><figcaption><p>Example of multiple filters applied to a table</p></figcaption></figure>

In addition, a number of small design improvements have been made to tables, including the ability to select for copy/paste labels shown in column cells.

### 🧾 Flow Details Page redesigned with contextual insights and shortcuts

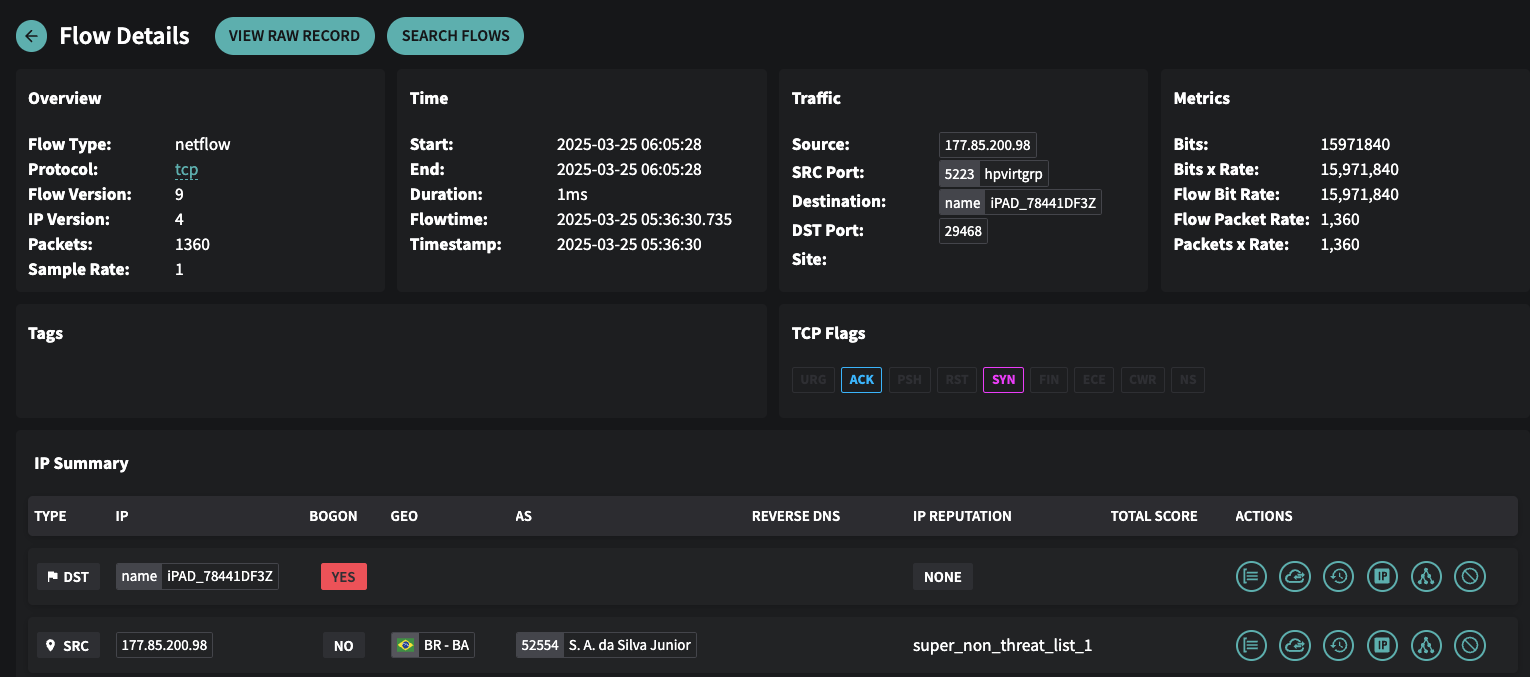
The new Flow Details page now shows the IP Summary table that was added in last month's release to the updated Event Details page. This includes more information about the source and destination IPs for the flow record directly on the page. It also includes buttons to get more directly to the most common next steps in investigating a flow.

The flow details page, as well as the **event details** page, now contain a **back button** at the top-left corner to close the Fusion tab and return to the table the details page was opened from.

<figure><img src="https://files.readme.io/4f04a08d1741c4dee3d6940ea7dc1dcf9f571f89c3b1ddf4e28e88f2a160f7fd-Fusion-FlowDetails.png" alt="Flow Details"><figcaption><p>Flow Details</p></figcaption></figure>

#### IP Summary Action Buttons

The IP Summary table in the Event Details and Flow Details page contains 6 clickable Action buttons on each row. These buttons were added to give you 1-click access to the most common actions. Previously, you would click the IP to bring up a property tray on the right-hand side of the Fusion Portal, and then select these actions from the bottom of that tray.

<figure><img src="https://files.readme.io/97095e4bd5ad8198c22b109fb2157d4009a0488c03535a223ed758ec6c4d3c68-Fusion-IPSummaryButtons.png" alt="Clickable buttons in IP Summary Table"><figcaption><p>Clickable buttons in IP Summary Table</p></figcaption></figure>

Hover over a button to see the tooltip describing it. The actions, from left to right, are:

* Search Flow
* Traffic Top
* IP Events History
* IP Intelligence
* IP Explorer
* Add IP to Discard List

### 📐 New averagein() and countin() threshold functions for Detection Models to handle high-latency ingest sources

When setting a threshold in a Detection Model, two new functions:

`averagein(window,metric)`

`countin(window,metric)`

These functions complement the `maxin(window,metric)` function that was added in last month's release.

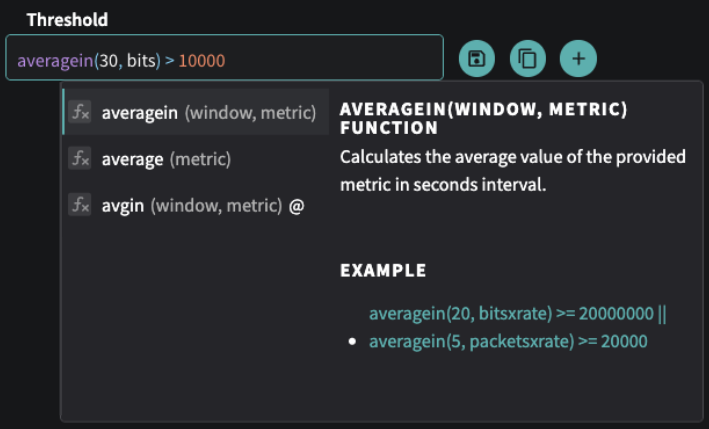
These functions perform a windowed aggregation of the given metric with a duration of seconds in the first argument. For instance:

`countin(30, bits) > 10000`

Translates to: *"if any period of 30 seconds across the entire rollup window has a total count of bits for all records that exceeds 10000."*

This is designed to allow traffic sources that may have late data ingest (eg latency in receiving flow logs or DNS resolver logs from a cloud provider) to have a rollup window that is long enough to account for the delay (up to 20 minutes) while not requiring aggregations for triggering that would hide “spikes” of data necessary for some detections. For example, if there is an acceptable baseline of failed queries, but a large number of failures in a short period of time is indicative of an attack.

While these threshold functions will be primarily used by Netography's Detection Engineering to build more robust and accurate detection models, it is available directly to use in your own detection models as well. If you need more guidance or assistance leveraging this new function, contact Netography Support.

<figure><img src="https://files.readme.io/20019cf94c6559b5a4457cec8adcb598110d4e12203cd179bd5422efb6d3e806-Fusion-Thresdhold-AverageIn.png" alt="Threshold averagein() function in Detection Model Configuration"><figcaption><p>Threshold averagein() function in Detection Model Configuration</p></figcaption></figure>

### 👥 Updated Roles Page

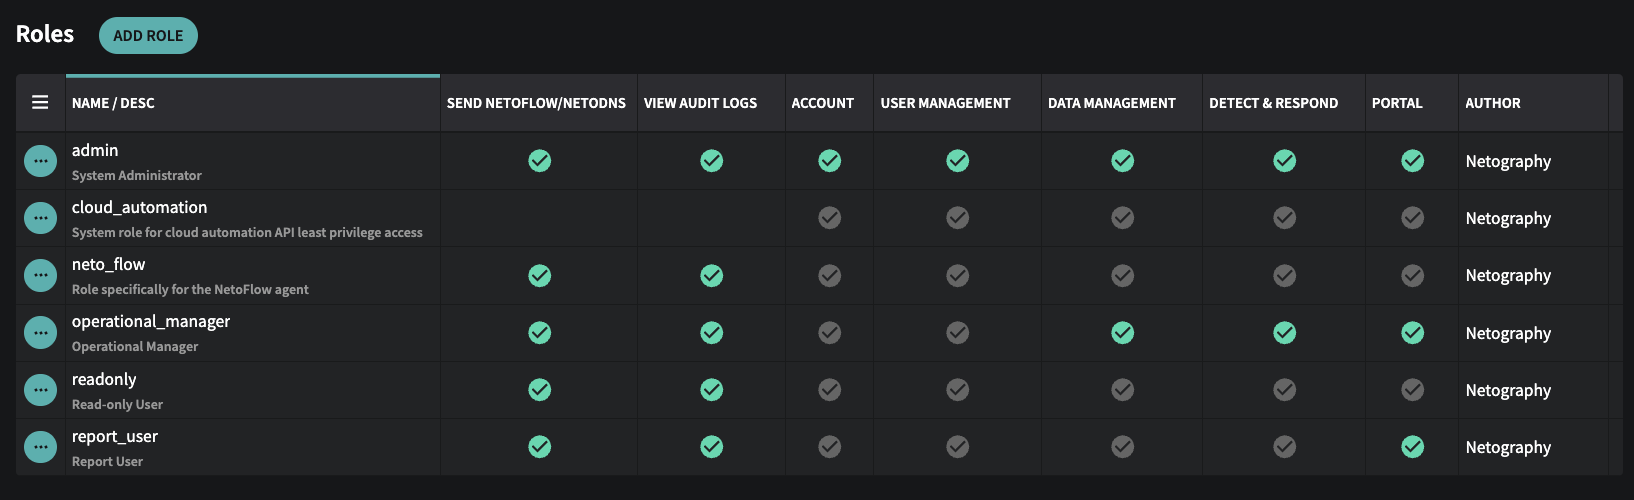
The **Roles** page at **Settings > Roles** has an updated design to allow you to see a summary of permissions for each role. To see the full permissions for the role, click the **⋯** button next to the role and select **Edit**.

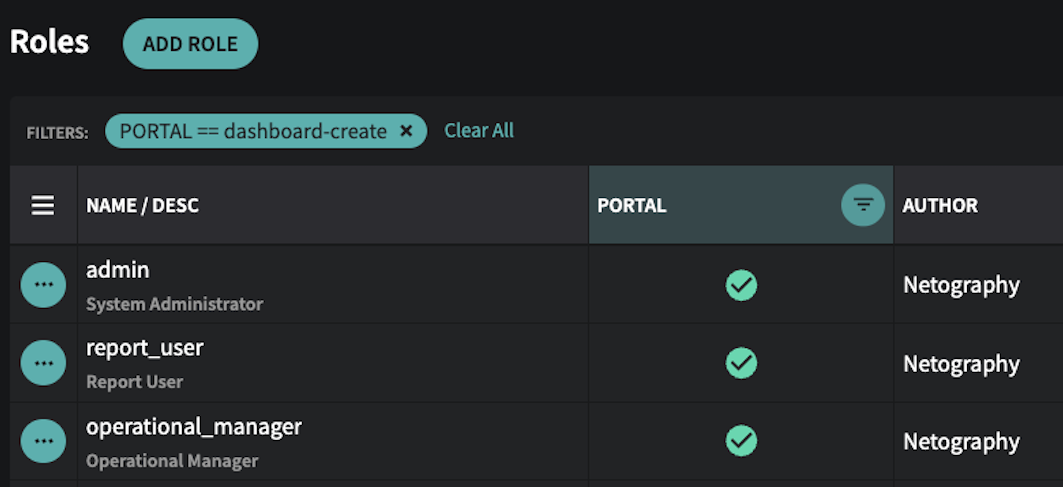
The summary of permissions in the table will show a green check if **ALL** permissions in that section are selected. It will have a gray check if **ANY** permission in that section is selected. You can choose a more granular specific permission to display in this table by adding a table filter. Hover over the column name and then click the filter icon that appears, and then choose the specific permission you want to filter by from the drop-down list.

<figure><img src="https://files.readme.io/2a6e07a092dd0a804afc5a5ad73883801294223ddfcf19e68c3b9e8f994a9c13-Fusion-Roles.png" alt="Settings > Roles with No Filters Applied"><figcaption><p>Settings > Roles with No Filters Applied</p></figcaption></figure>

<figure><img src="https://files.readme.io/2aabdb611a887d1b4f22ffdf8b027aab12504922b72132e71f023f7ef015b086-Fusion-Roles-FilterExample.png" alt="Settings > Roles with filter to show Roles with permission to create dashboards"><figcaption><p>Settings > Roles with filter to show Roles with permission to create dashboards</p></figcaption></figure>

### Event Details Page Refinements

The Event Details Page that was redesigned in last month's release has had some further refinements based on user feedback. This includes moving the Detection Model summary to be more prominent, improving the ability to resize columns in the IP Summary table, and other small changes.


---

# Agent Instructions: Querying This Documentation

If you need additional information that is not directly available in this page, you can query the documentation dynamically by asking a question.

Perform an HTTP GET request on the current page URL with the `ask` query parameter:

```
GET https://docs.fusion.vectra.ai/release-notes/2025/march-25-2025.md?ask=<question>
```

The question should be specific, self-contained, and written in natural language.
The response will contain a direct answer to the question and relevant excerpts and sources from the documentation.

Use this mechanism when the answer is not explicitly present in the current page, you need clarification or additional context, or you want to retrieve related documentation sections.